I use hadoop to analyze the data and R to plot some charts to assist me
Sent from my iPad using Tapatalk
I use hadoop to analyze the data and R to plot some charts to assist me
Sent from my iPad using Tapatalk
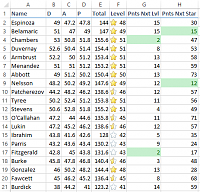
I use a spreadsheet to break down average form by position. Does your DC have an average form of 8 at LDC, but only 7 at CDC and RDC? Wish the game did this for you.
Manager of Foresters FC and Guide FC. Both teams on server '161'.
Wondering if I took the time to type out that fancy formation? Nah, check out my python script!
Suit yourself. Thanks to my very simple Excel document I figured out that the team rating is an average of the player levels, not an average of all spent skill points. Thanks to that simple revelation I beat a tough league opponent by a wide margin because my training was more effective.
Manager of Foresters FC and Guide FC. Both teams on server '161'.
Wondering if I took the time to type out that fancy formation? Nah, check out my python script!
I use my brain for working out skill
15 Titles
10 Runner-up
5 Champions league
2 Runner-up
4 Cups
2 Runner-up
1 Treble
I have some players whose average form is different by about 1, but this is with a limited number of data points. I need to be patient and collect more before drawing any conclusions.
My spreadsheet also breaks it down by type of game (Leauge, CL, Cup). It appears as if some players perform 1-2 form points better in one type of game over the others. This is not just due to lower skill levels in league games. Some prefer cup or CL. Although this is more easily observed because the game does show us the last several forms broken into game type.